Explore collaborations between (sub-)organizations with Ricgraph
Introduction
Using Ricgraph, you can explore collaborations between (sub-)organizations. You can also filter them on categories of research results (e.g., journal article, data set, software, etc.), year, license, and/or access.
You may want to do that, because researchers rarely work alone: they work with colleagues within and between organizations on all organizational levels. They collaborate on a variety of research results beyond traditional publications. However, collaboration indicators in research assessment usually rely on a single source, focus on top‑level institutions, and may focus on journal articles only. This limits what can be seen about collaborations within organizations, and for results such as data sets and software.
Ricgraph offers a multi‑source, multi-level, graph‑based approach to collaboration indicators. Publications, data sets, software, persons, and organizational information from multiple systems are integrated into a single graph. Collaborations are defined as shared research results connecting organizations via persons. They are quantified on top-level organization, as well as on faculty and departmental level, providing a concrete operationalization of multi‑source, multi‑level collaboration indicators for science‑of‑science research.
Combining multiple sources substantially increases the observed coverage of collaborations, especially for data set and software collaborations.
You can read more in Rik D.T. Janssen (2025). Utilizing Ricgraph to gain insights into research collaborations across institutions, at every organizational level. [preprint]. https://doi.org/10.2139/ssrn.5524439. A journal article of a revised version of this preprint is in review.
How to do this?
- Go to Pilot Open Ricgraph demo server to find the link to the Open Ricgraph demo server.
- Click “explore collaborations”. You will get to a page that explains what you can do and how it works.
- Choose a start organization, and (optional) a collaborating organization.
- Choose whether you want to restrict the collaborations to research results of a specific category (e.g., only show collaborations related to journal articles, data sets, or software).
- Choose how you want to explore the collaborations.
If you choose the Sankey diagram, with start organization = AUMC Division: and collaborating organization = DUT Faculty: (AUMC = Amsterdam University Medical Centers, DUT = Delft University of Technology), you will get a diagram with the collaborations between those sub-organizations, as in the following image (it will very probably differ, since new research results will have been added since this screenshot was made in May 2026).
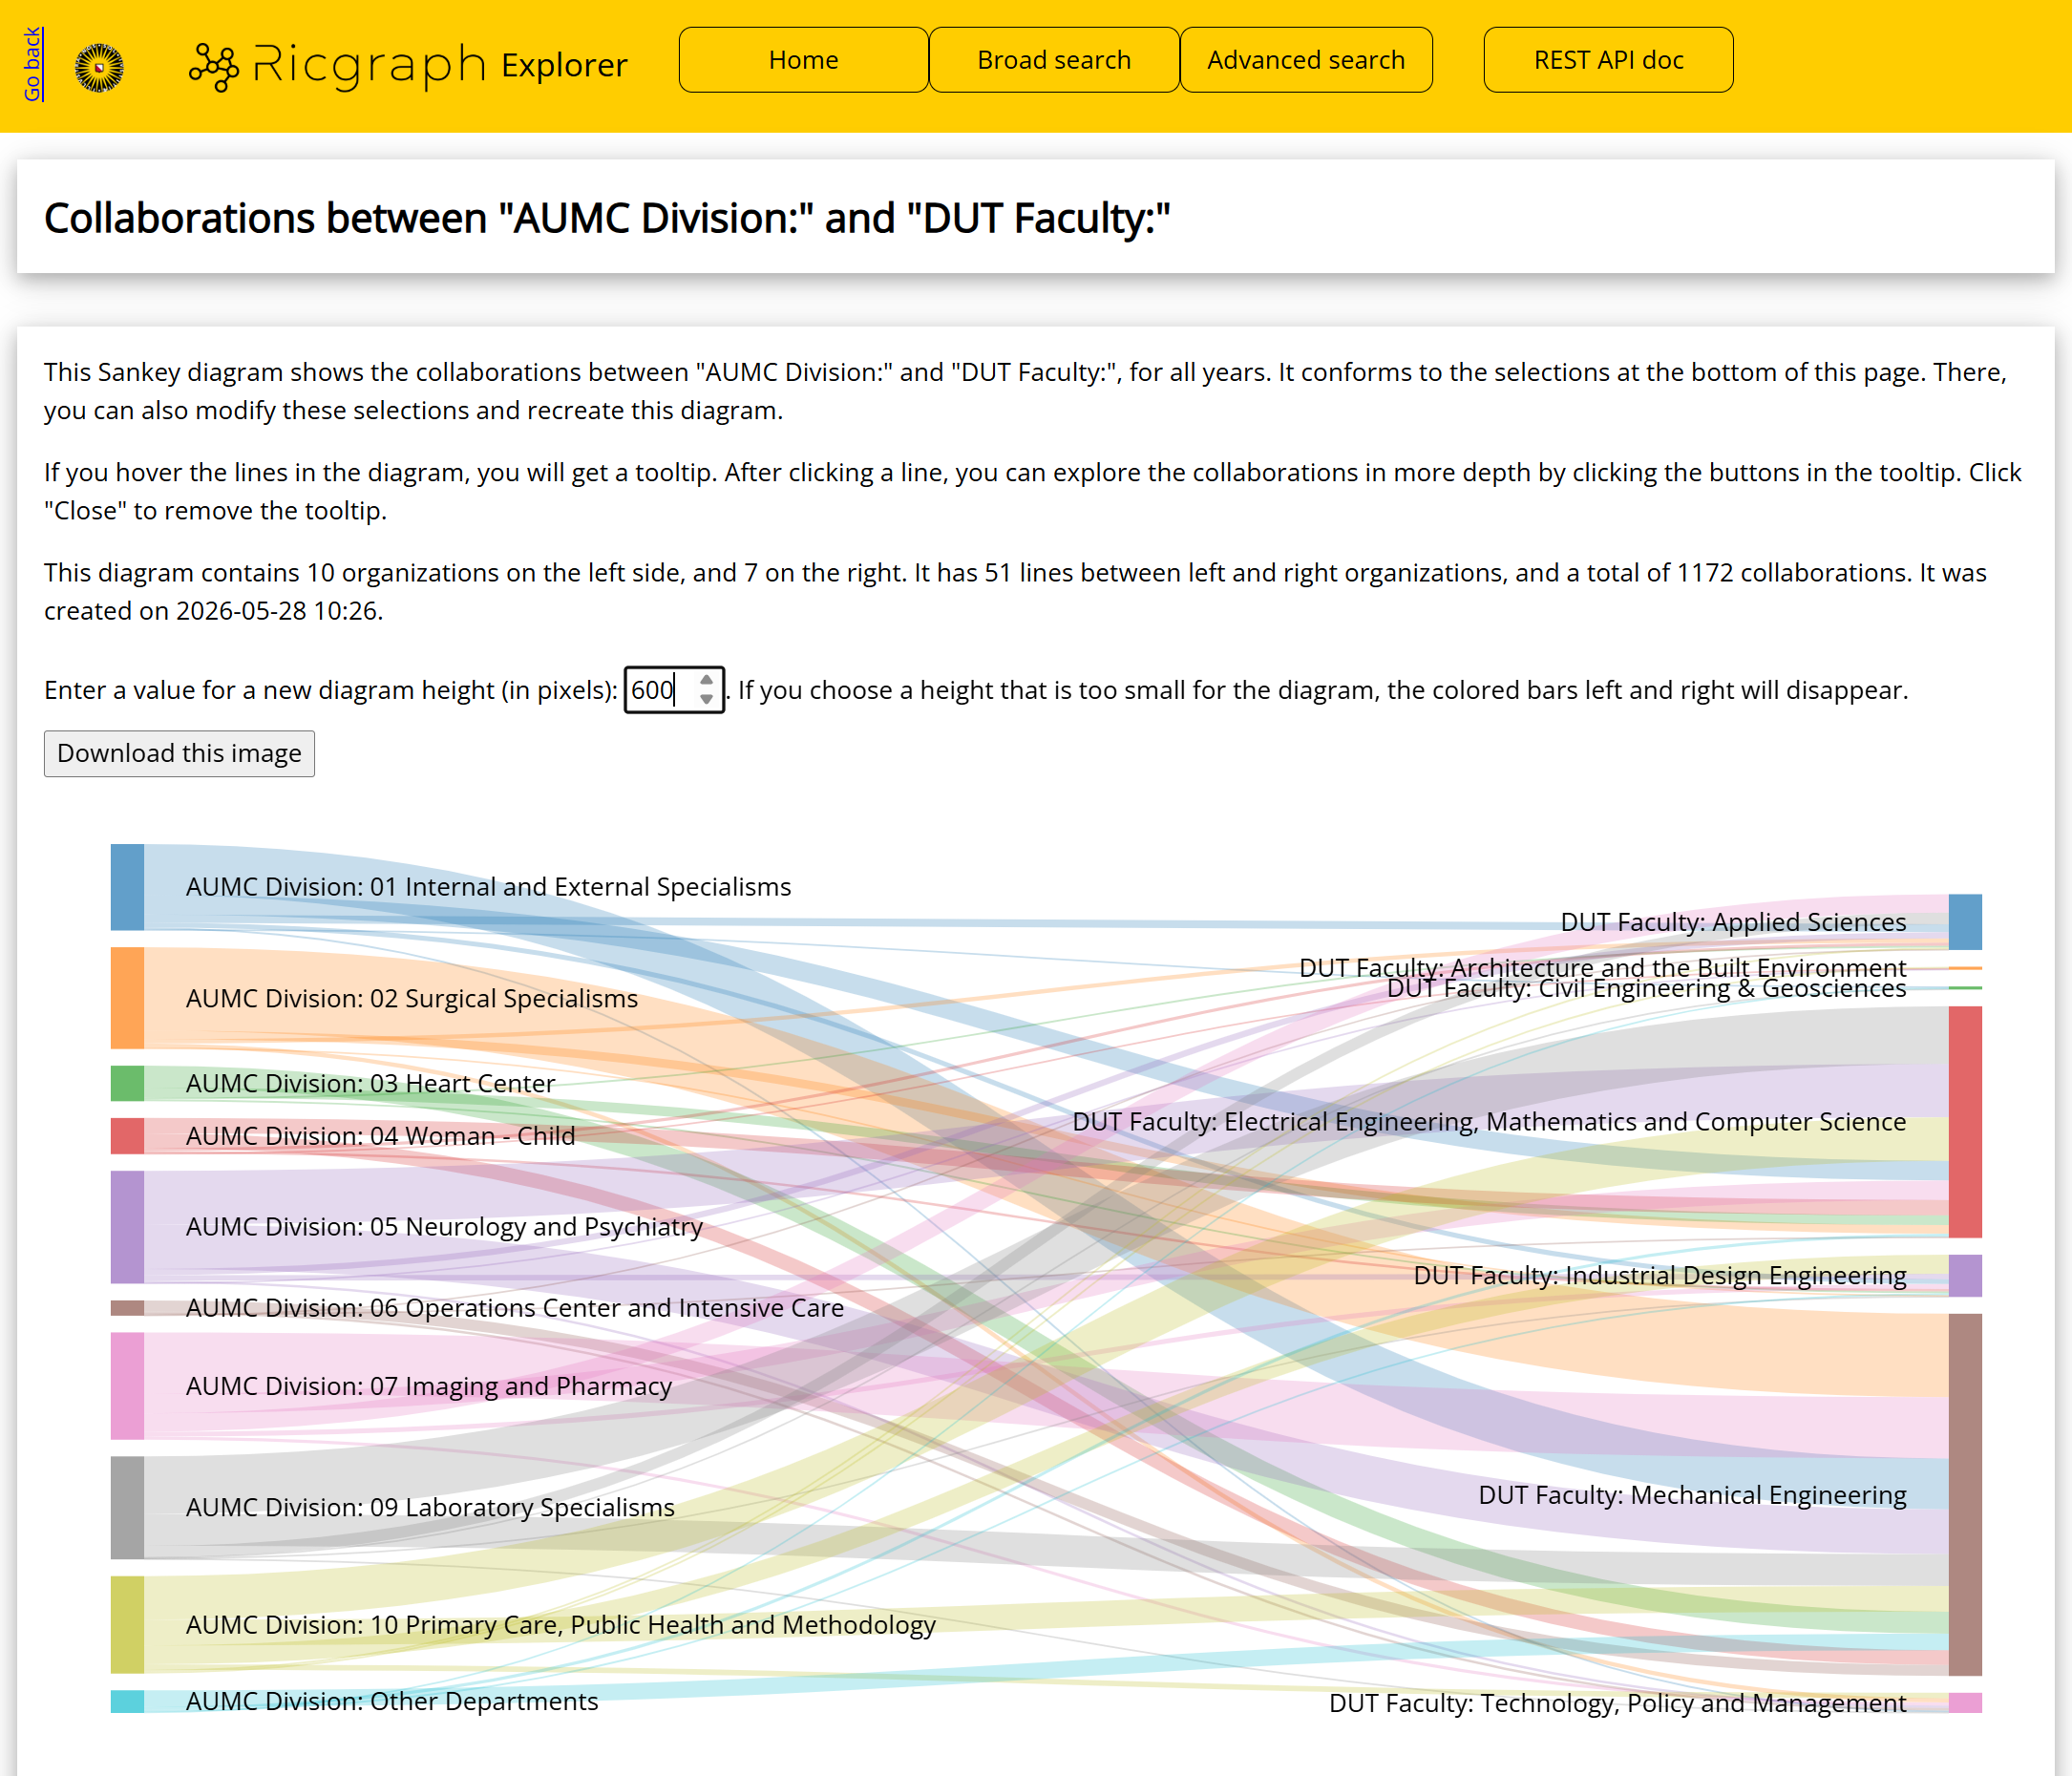
If you hover the lines in the diagram (in Ricgraph, not in the image above), you will get a tooltip. After clicking a line, you can explore the collaborations in more depth. This means, that for every collaboration, you can explore its research results, and the persons from both sub-organizations that were involved in that collaboration (on the left and right side of the diagram).
You can modify this diagram by filtering on category, year, license, and access:
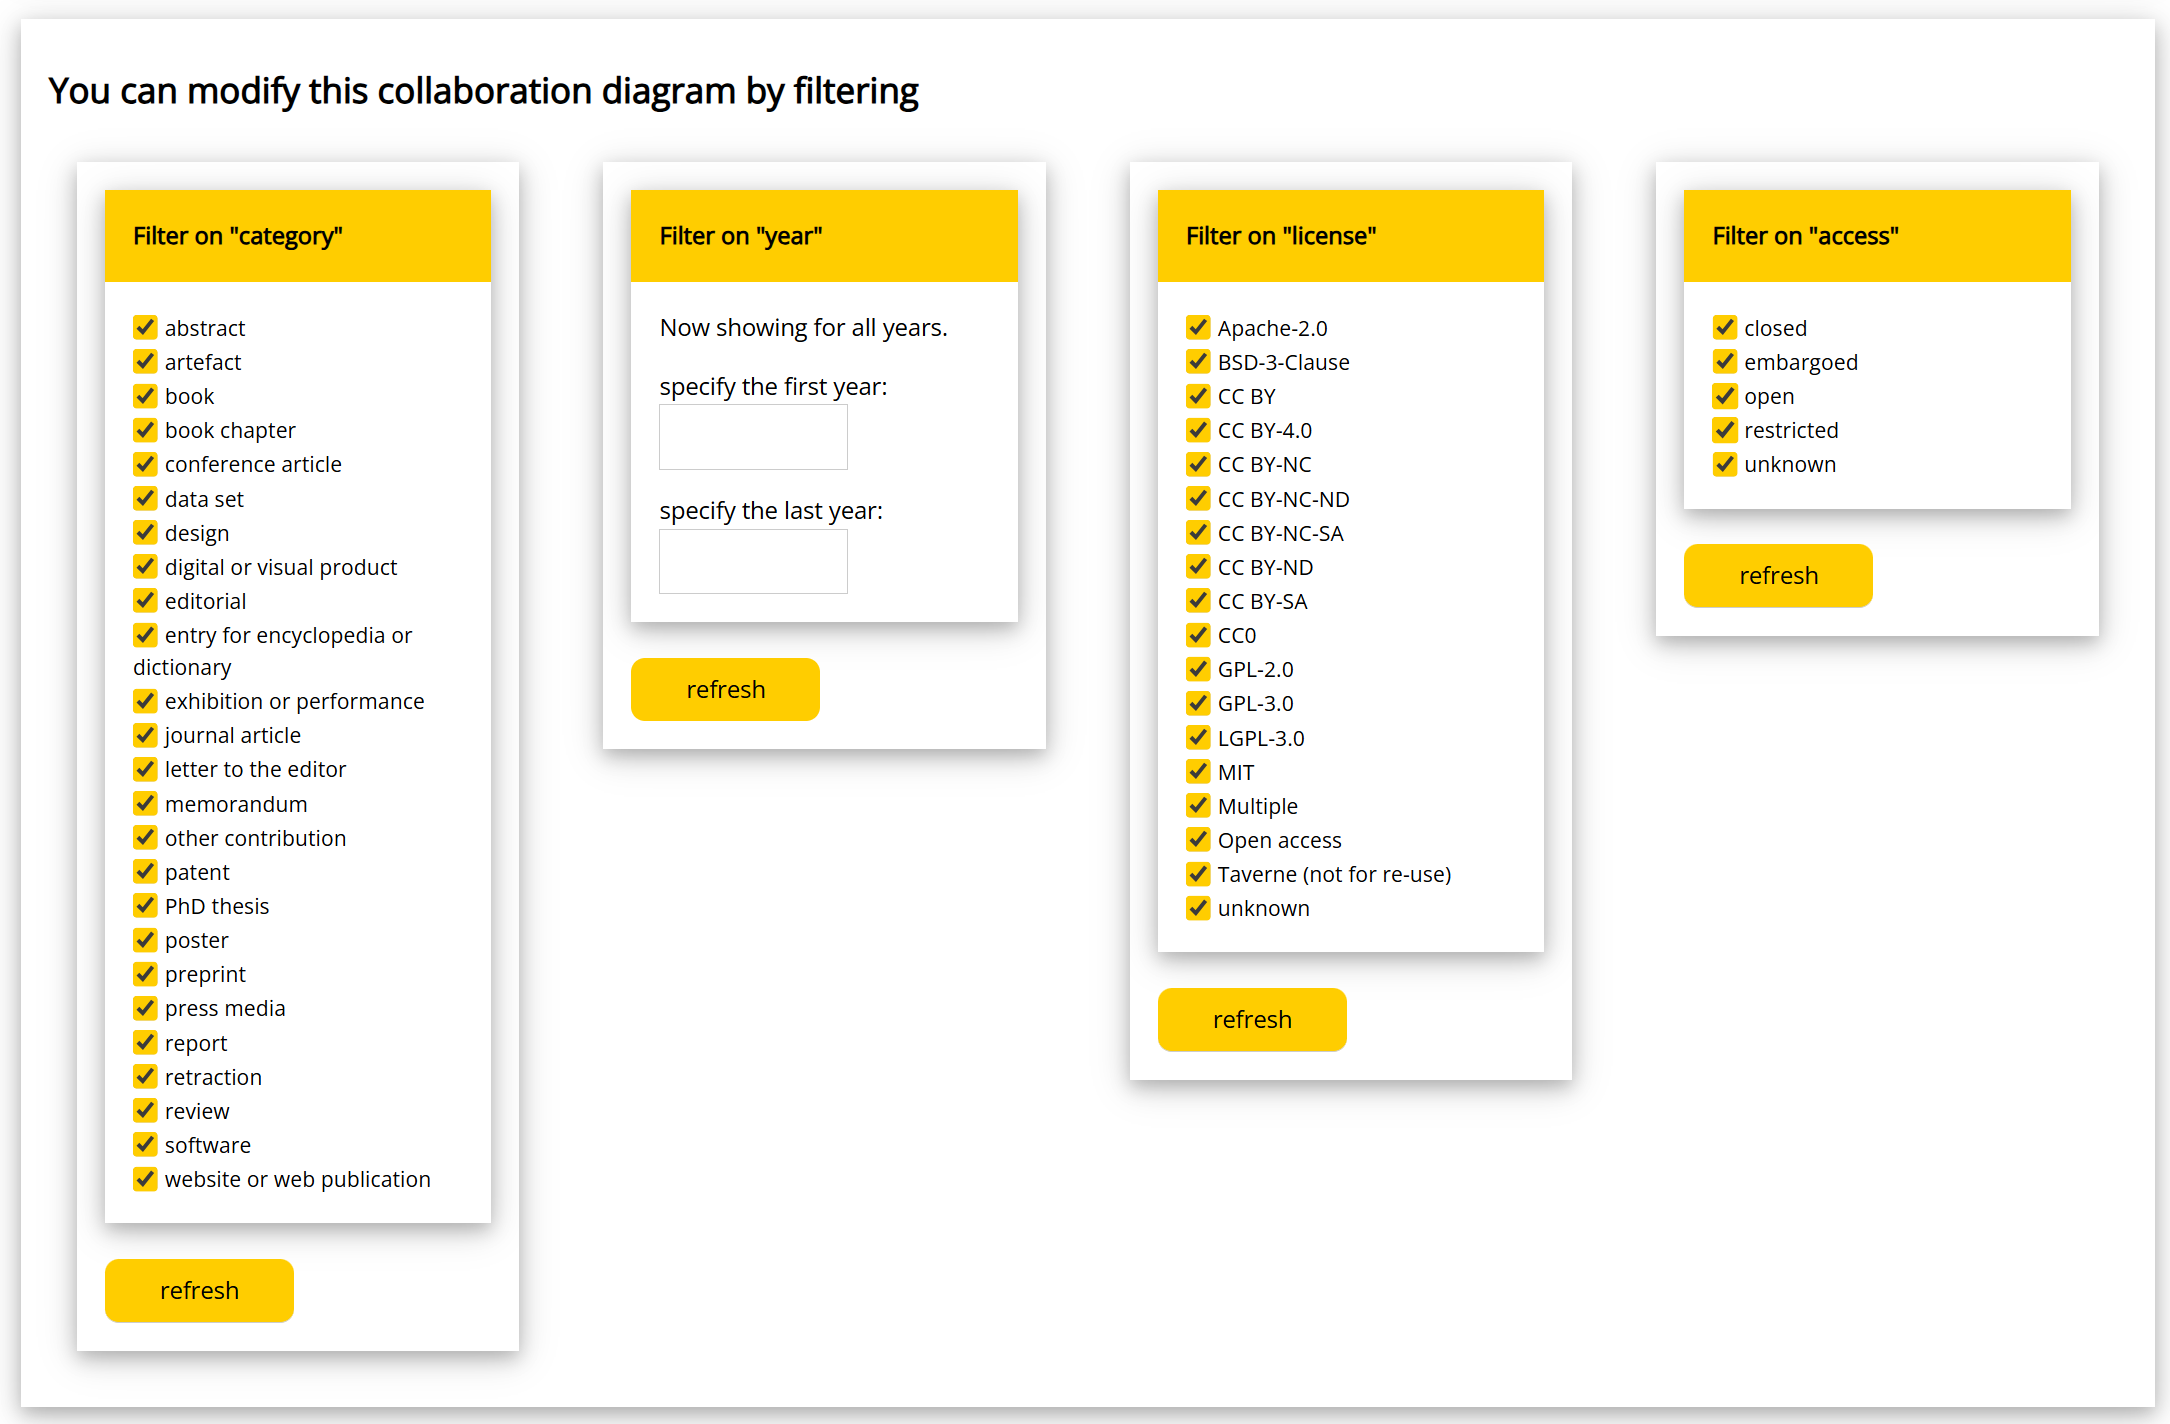
After you click “refresh”, the collaboration diagram will be regenerated. This means that you can create collaboration diagrams for a number of (sub-)organizations, and compare these over a number of years, or on their access value (or on other filters). Or both: you can explore how the access value of research results that lie at the basis of the collaborations varies over the years.
Next steps
Read about Explore the open science landscape with Ricgraph. Go to the Contact page.