Explore the open science landscape with Ricgraph
At the moment, Ricgraph offers three options to explore the open science landscape:
- Get an Open science profile for a (sub-)organization.
- Get an Open science dashboard for a (sub-)organization.
- Explore collaborations between (sub-)organizations with Ricgraph.
One of the strengths of Ricgraph is that anyone with Python knowledge can easily extend it, allowing you to test your own ideas or create your own applications.
That means, that if you have an idea for an open science indicator, you can implement it in Ricgraph. Then, you can apply it to your own research information (and to research information from other organizations, if you have it), and assess it actual usefulness. If you are experienced with Python and Ricgraph, implementing such an indicator can be done in a few days.
Get an Open science profile for a (sub-)organization
In Ricgraph, an Open science profile relates to the distribution of research results for a certain (sub-)organization, in the three groups research material, reporting material, and engagement material. It is said that the form of this distribution may be characteristic for such a (sub-)organization. It is possible to filter on year, license, and/or access.
These three groups are defined as:
- Research material: input and supporting material of the research. E.g., the research result categories data set, software.
- Reporting material: documents reporting on process and results of research. E.g., the research result categories book, conference article, journal article, etc.
- Engagement material: everything used to involve stakeholders and wider audiences into influencing the research and using or implementing its results. E.g., the research result categories patent, press media, website or web publication.
How to do this?
- Go to Pilot Open Ricgraph demo server to find the link to the Open Ricgraph demo server.
- Click “explore the open science landscape”. Then click “get an open science profile for a (sub-)organization”.
- Type an organization name, or part of it. If there are multiple matches, you can choose one.
- You will get an Open science profile for that (sub-)organization.
If you choose “VUA Faculty: Faculty of Social Sciences and Humanities” (VUA = Vrije Universiteit Amsterdam), you will get a profile as in the following image (it will very probably differ, since new research results will have been added since this screenshot was made in May 2026). Below the diagram you can click buttons to inspect the research results in each of the three groups.
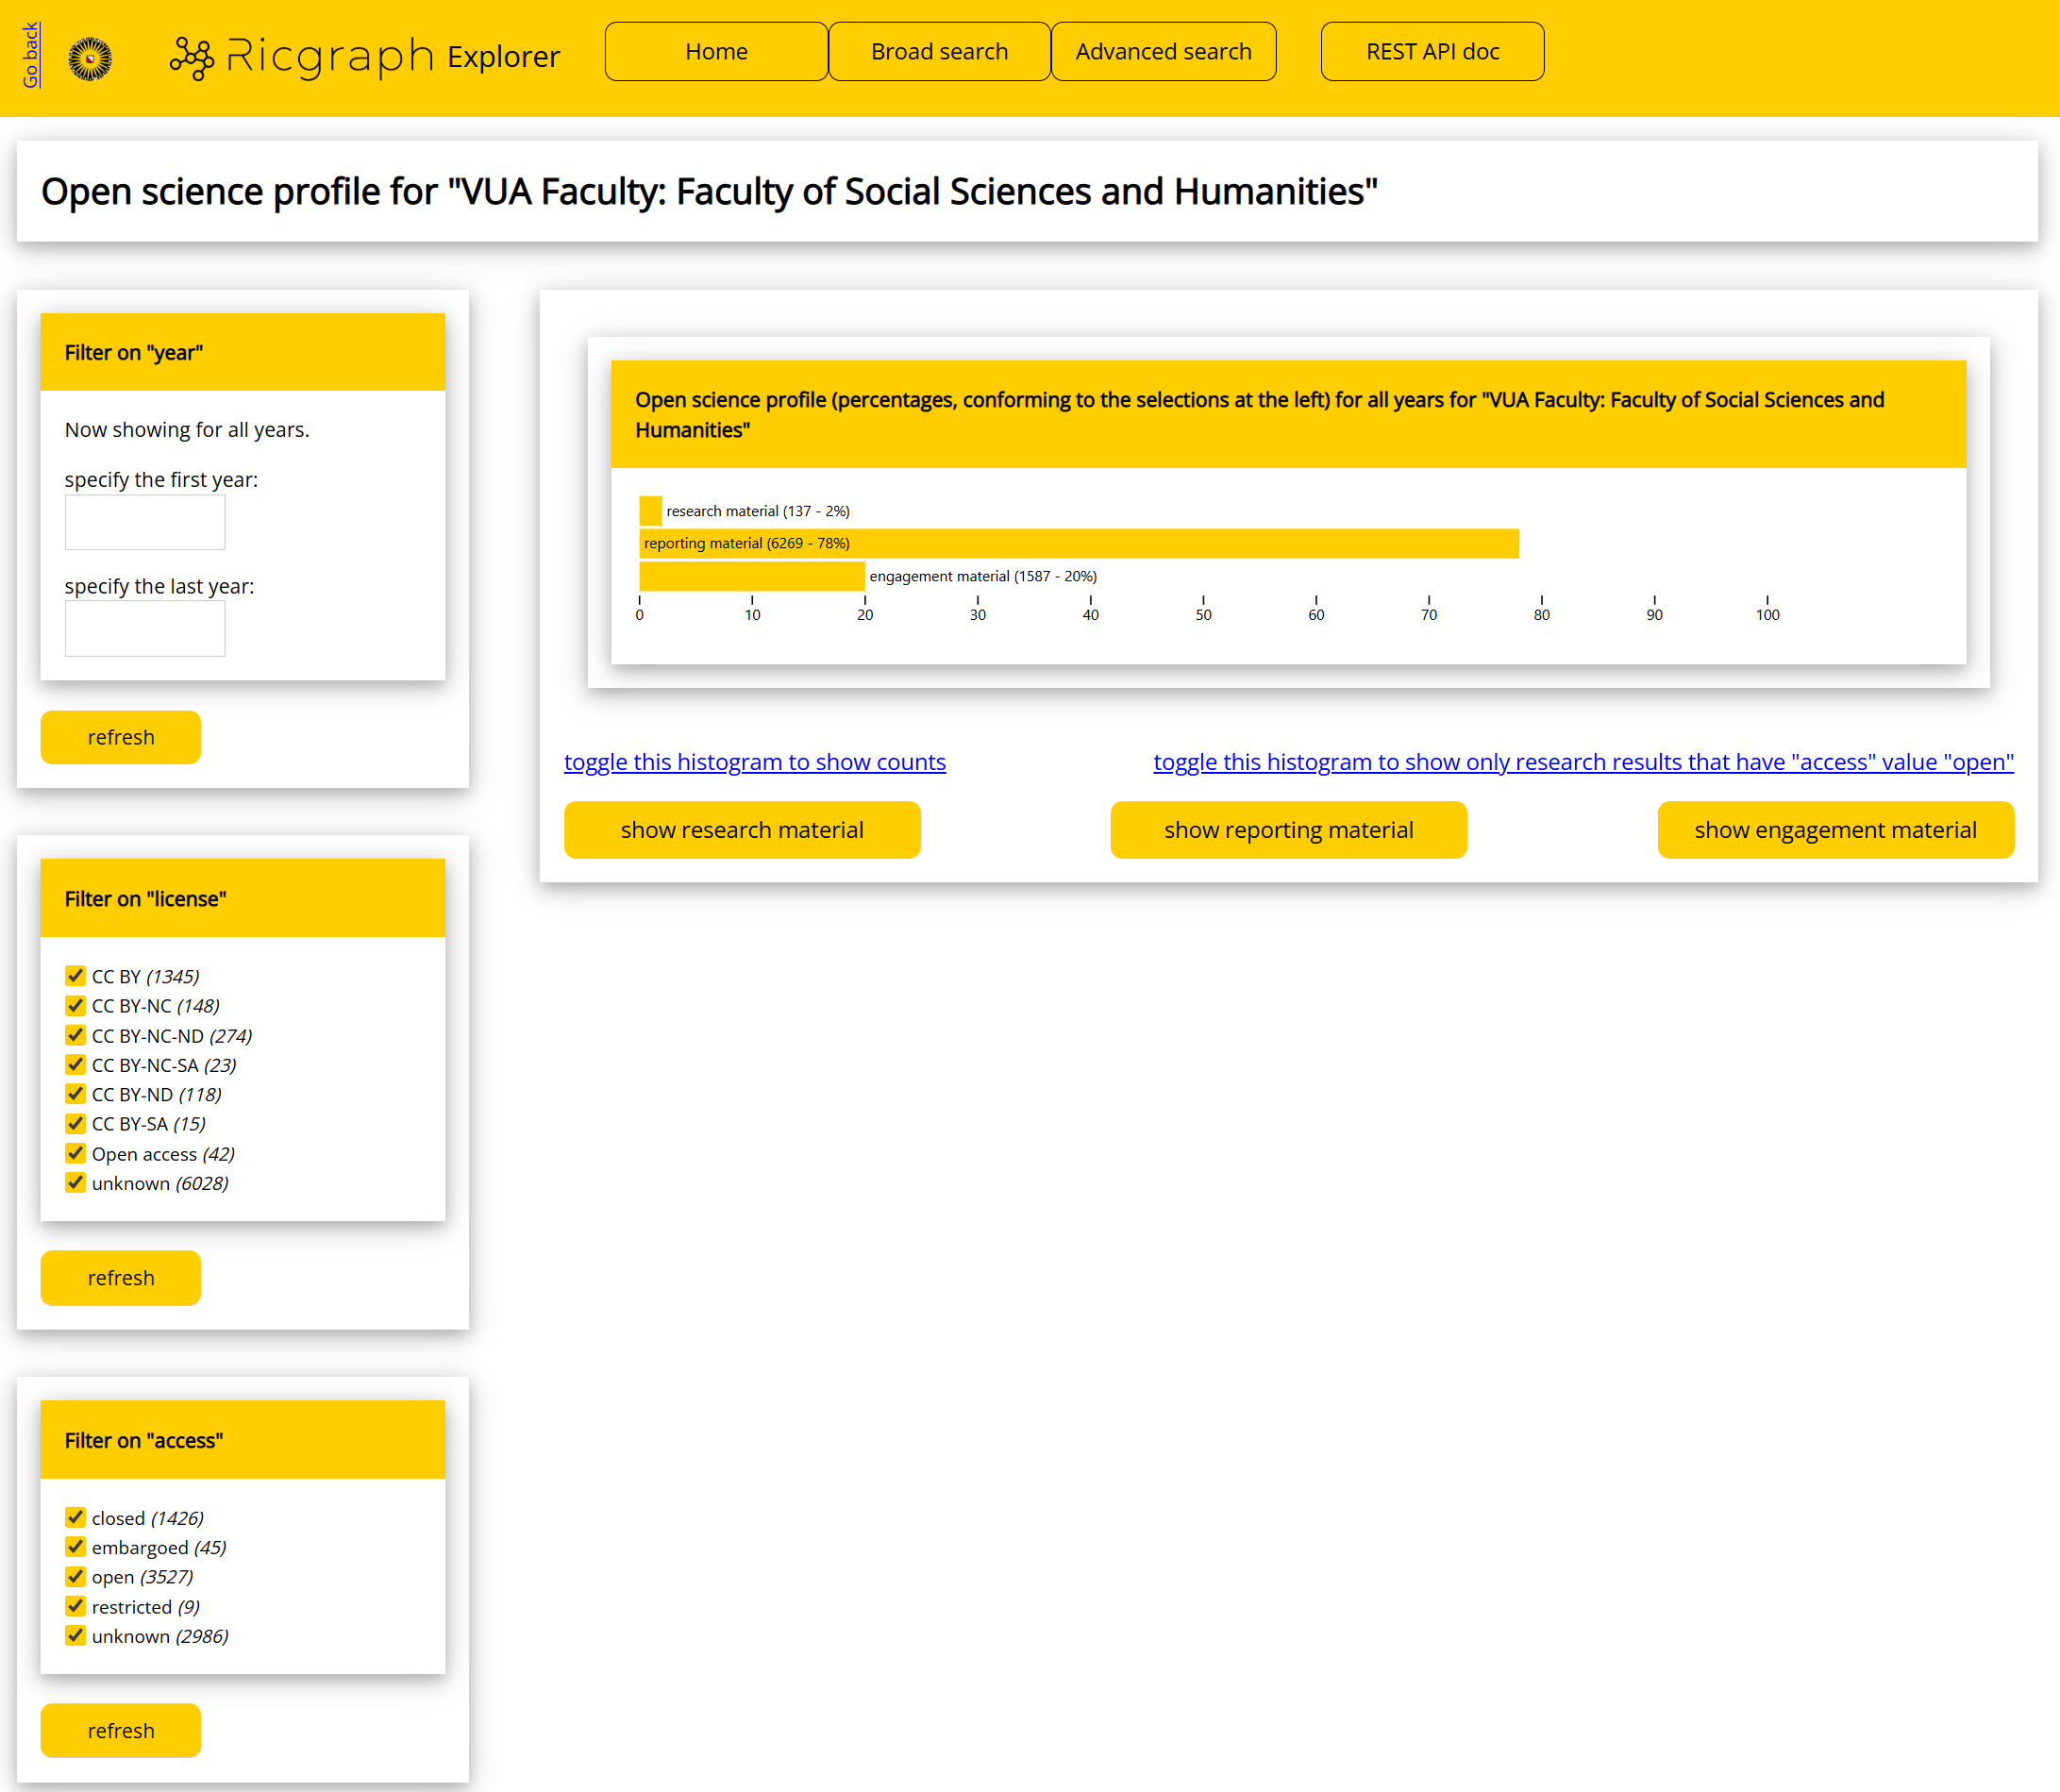
As shown in the left part of this figure, you can modify the Open science profile by filtering on year, license, and access. The license and access filters also include counts.
After you click “refresh”, the Open science profile will be regenerated. This means that you can create open science profiles and compare these for various years, or on access value (or on other filters). Or both: you can explore how the access value of research results varies over the years, and how that influences the open science profile.
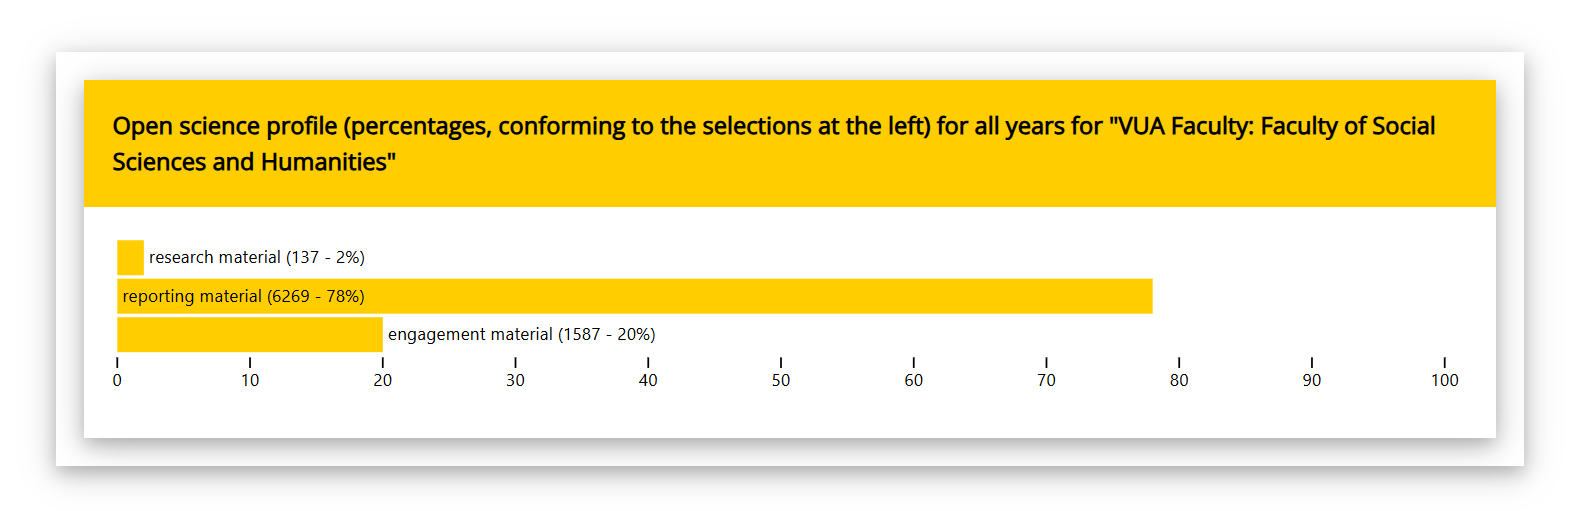
To assess whether this distribution is characteristic for a sub-organization, observe the Open science profile for “VUA Faculty: Faculty of Social Sciences and Humanities”:
and for “VUA Faculty: Faculty of Science”:
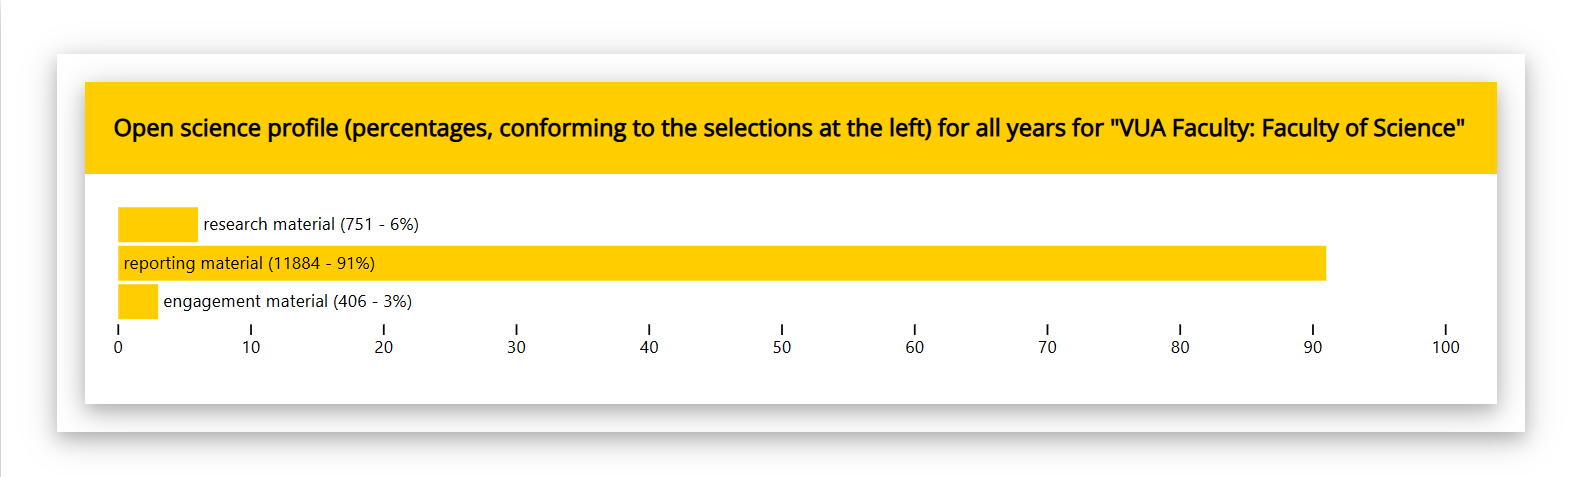
It can be observed that “VUA Faculty: Faculty of Social Sciences and Humanities” has more engagement material. Whether this means something, can only be concluded by looking at the strategy of both faculties, the strategy of the Vrije Universiteit Amsterdam, and by inspecting the research results involved. Also, the differences can be caused by missing information in the source systems. So one should take caution by conclusions from these profiles.
Get an Open science dashboard for a (sub-)organization
In Ricgraph, an Open science dashboard is a histogram of the various categories of research results for a certain (sub-)organization. It also shows histograms on year, license, and access. It is possible to filter on category, year, license, and/or access.
How to do this?
- Go to Pilot Open Ricgraph demo server to find the link to the Open Ricgraph demo server.
- Click “explore the open science landscape”. Then click “get an open science dashboard for a (sub-)organization”.
- Type an organization name, or part of it. If there are multiple matches, you can choose one.
- You will get an Open science dashboard for that (sub-)organization.
If you choose “VUA Faculty: Faculty of Social Sciences and Humanities” (VUA = Vrije Universiteit Amsterdam), you will get a dashboard as in the following image (it will very probably differ, since new research results will have been added since this screenshot was made in May 2026). Below the diagram you can click buttons to inspect the research results for each category in the histogram.
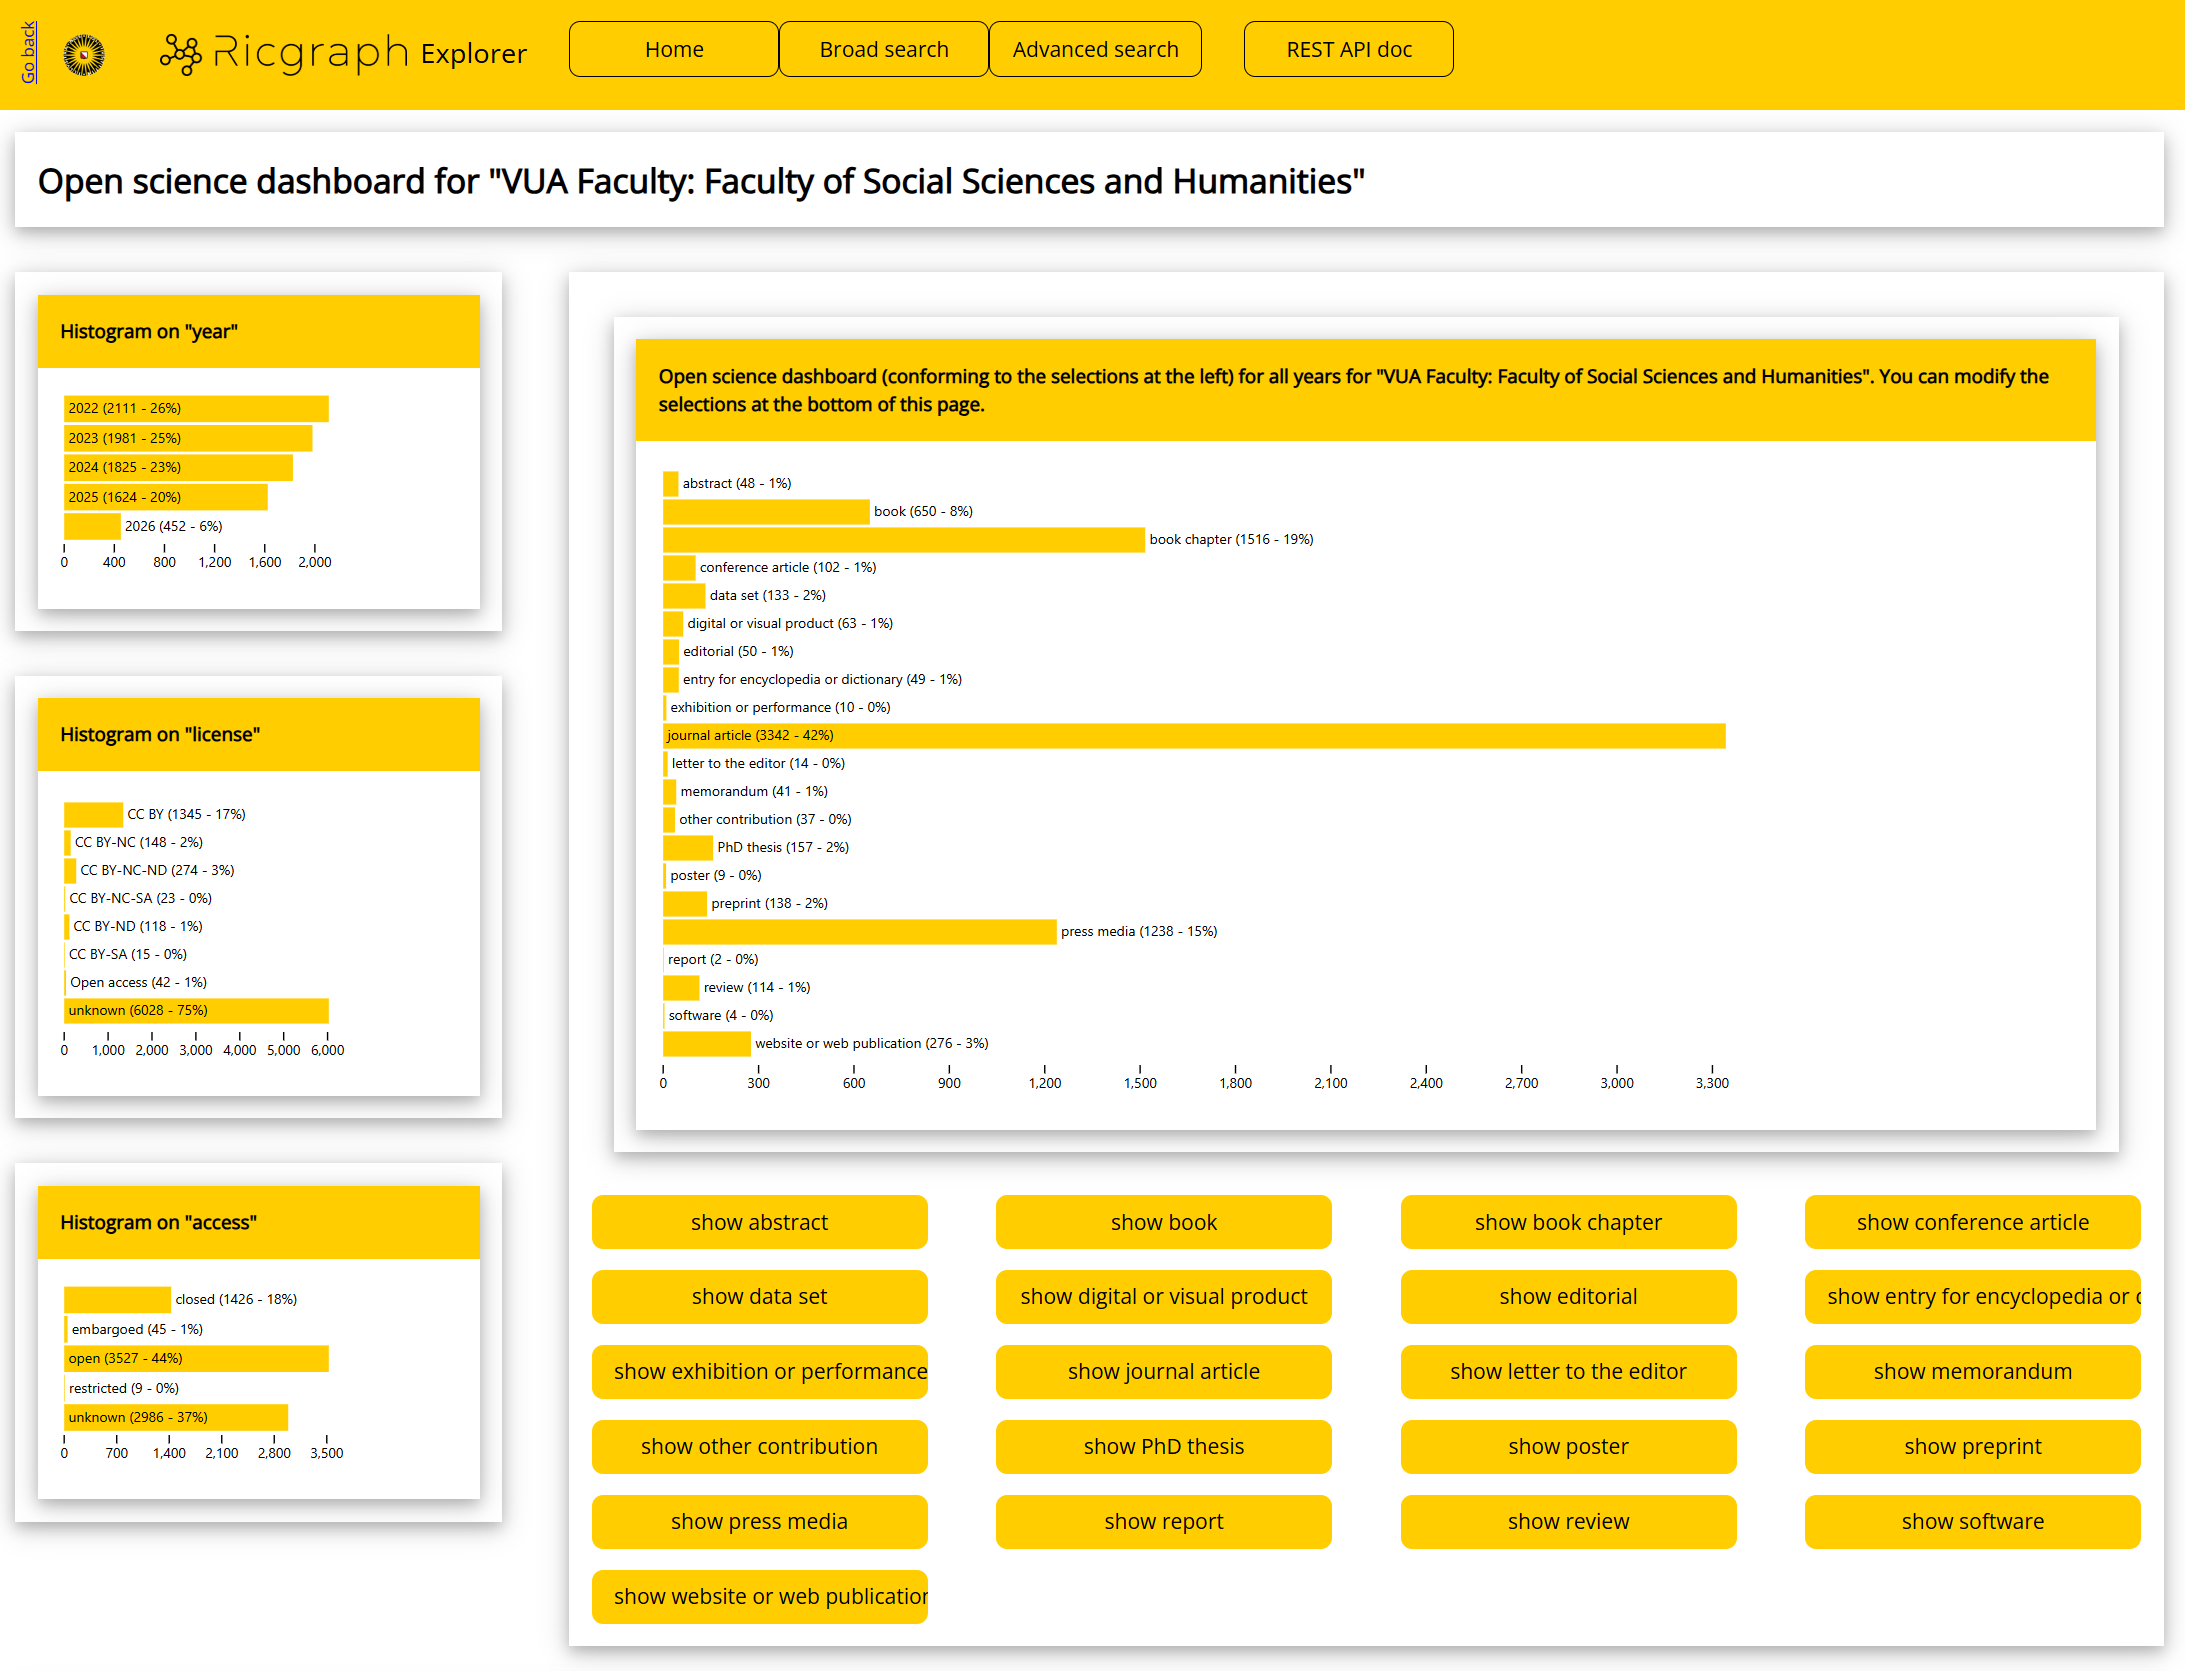
Note that it resembles the Open science profile for a (sub-)organization, but that it uses all categories of research results. In some cases, the Open science dashboard is what you want, while in others, you might like the Open science profile.
You can modify this dashboard by filtering on category, year, license, and access:
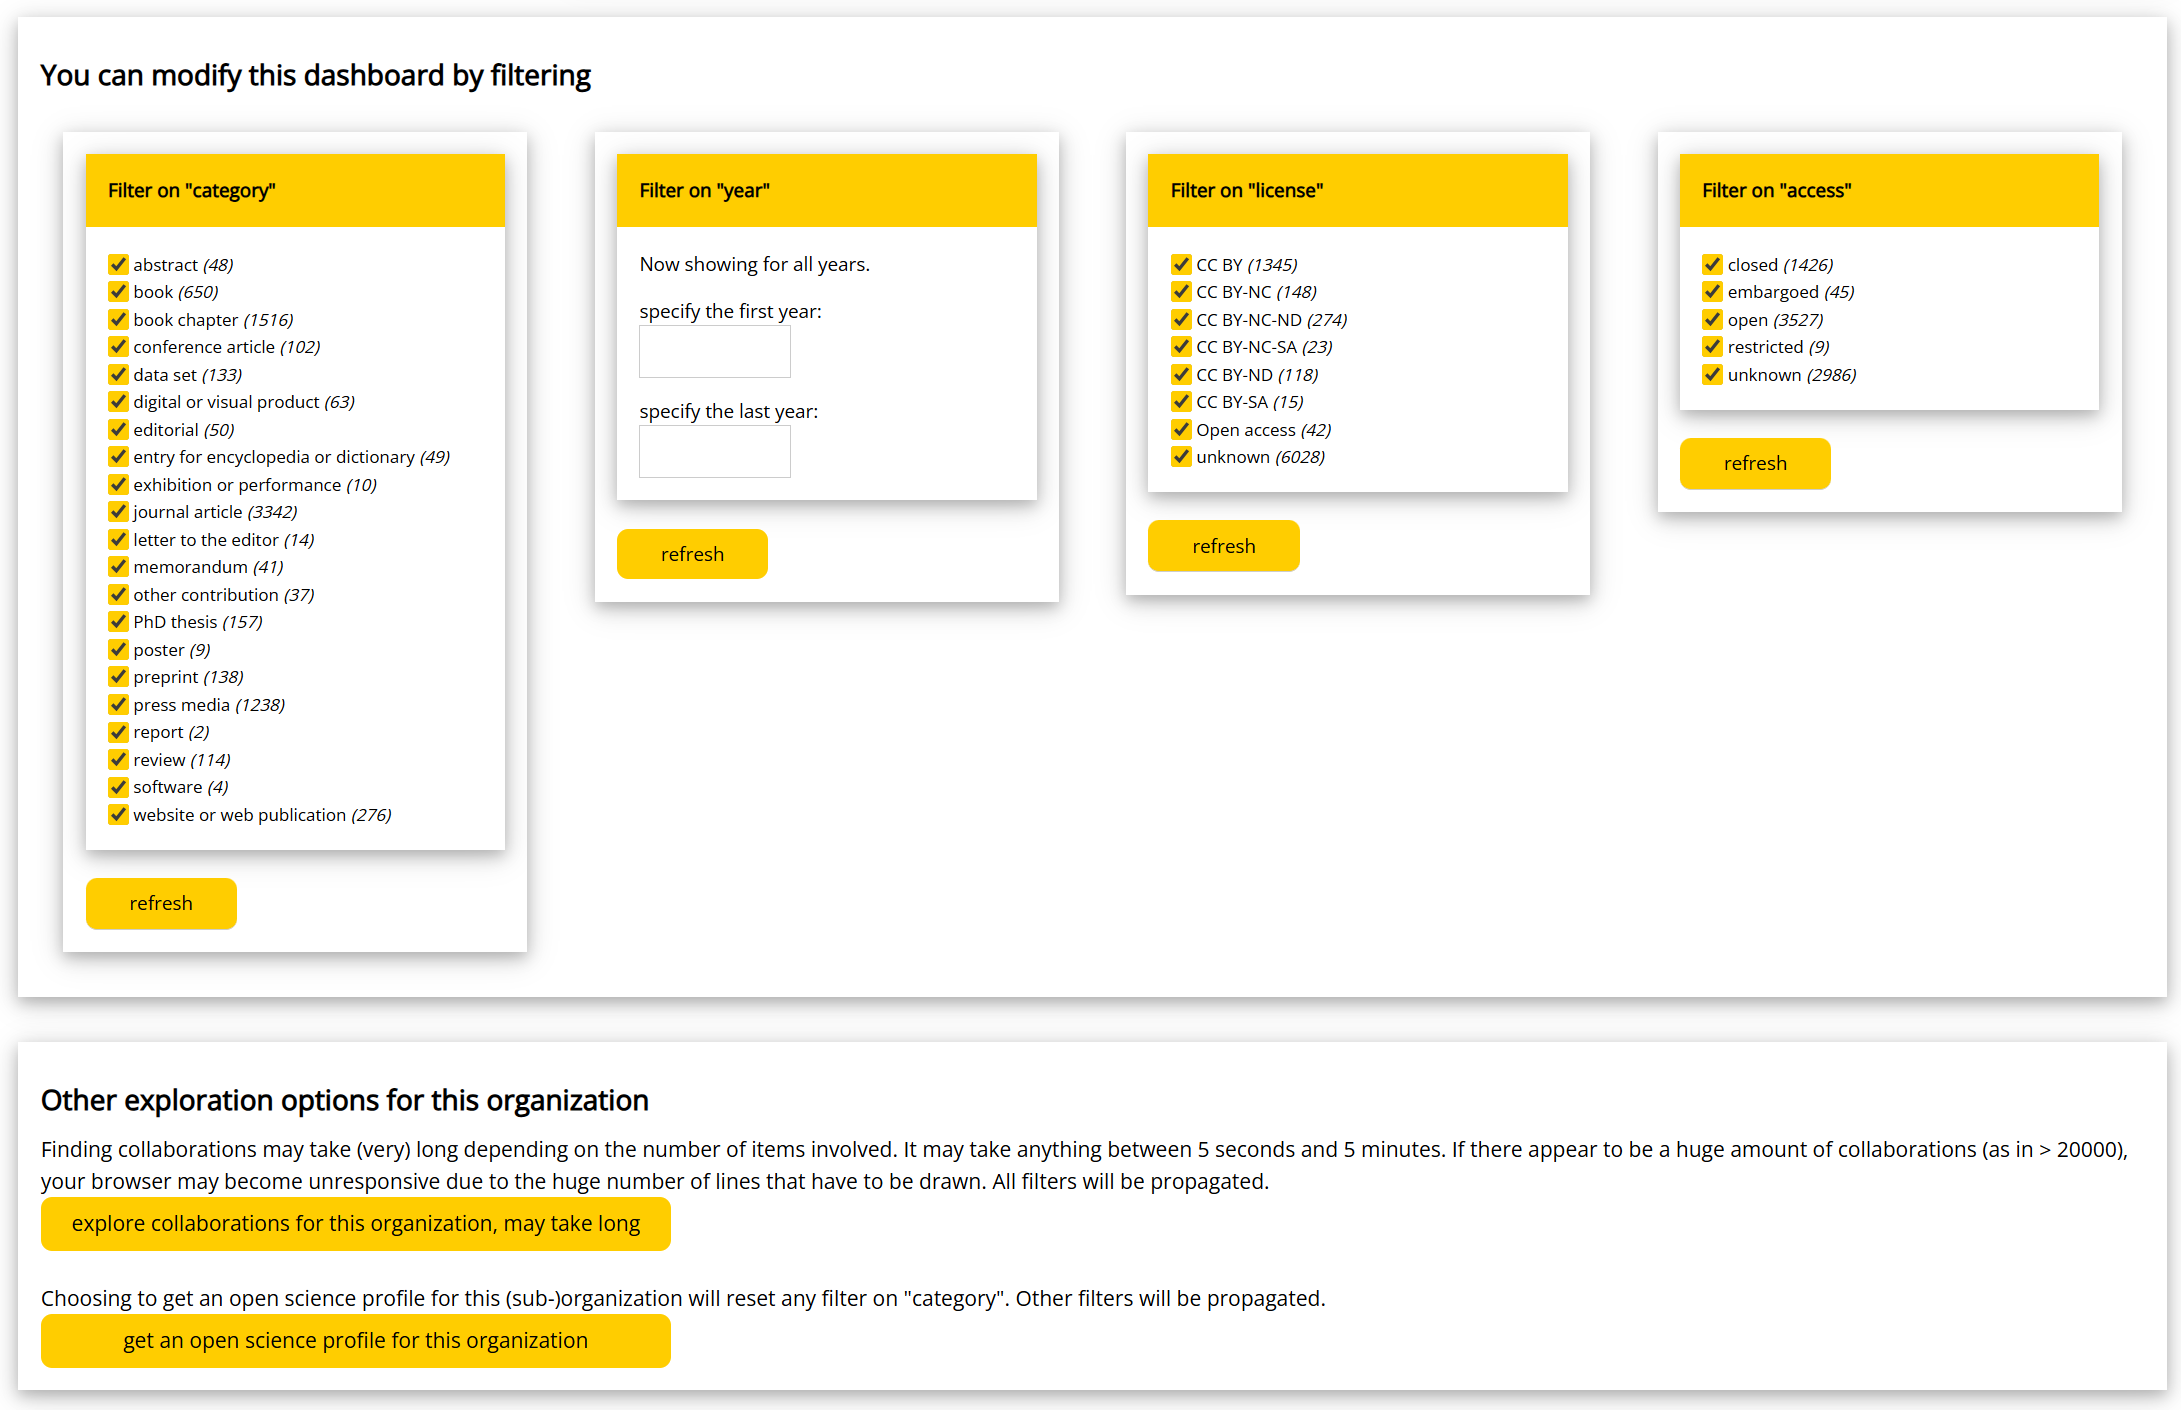
After you click “refresh”, the dashboard will be regenerated. This means that you can create dashboards for a (sub-)organization, and compare them over a number of years, or on their access value (or on other filters). Or both: you can explore how the access value of research results for a (sub-)organization varies over the years.
Below the filters, there are two buttons that provide more insight in the selected organization:
Next steps
Read about Enhancing research information systems with Ricgraph. Go to the Contact page.